A $500 DIY near-IR spectrometer that would sell for $10,000
DIYing spectrometers is not new. You can make one with your phone camera, and a broken piece from a CD-ROM as a diffraction grating. There are plenty of tutorials for this online. It takes $5 to make one.
However, a silicon based camera (CMOS sensor) only respond up to ~1100 nm in wavelength, and this is a physical limitation —— silicon has a band gap of ~1.1 eV, and you cannot excite electron-hole pairs with wavelength longer than about ~1100 nm. So we need a different semiconductor if we want to measure any light above this wavelength. A popular choice is InGaAs, whose bandgap is tunable down to ~0.4 eV by changing content of indium versus gallium.
But you probably don't want to know how much a InGaAs camera will cost you... While a silicon-based camera is as cheap as dirt these days, an one-dimensional InGaAs pixel array already costs upper few thousand dollars. Any full-blown IR spectrometer system goes way over $10k, with their fancy thermoelectric cooling and precision gratings (we actually have one in our lab). The reason why they are so expensive is that the target user group are scientific researchers, not consumers.
Since I have been recently interested in laser optics (as a hobby) and wish to DIY some laser systems, which inevitably requires working with near-IR wavelengths (above 1100 nm), I desperately needs a way to analyze what light I'm producing out of my laser crystals. One day I tried to search for InGaAs photodiodes on DigiKey and it turns out that a single InGaAs photodiode sells for ~20 bucks. While its 100x more expensive than a silicon photodiode, I figured that you can make a spectrometer just with this one photodiode, and it's definitely within reach of DIY. And here it is —— a fiber-coupled IR spectrometer that measures from 800~1600 nm.
Contents
Design
A spectrometer mainly consists of four components: slit, diffracting element, detector, and relaying optics between these parts. In our case, the input optical fiber acts as our input slit. I chose to use a 50 um core multi-mode fiber for a compromise between light throughput and spectral resolution. A 2-m long SMA-905 fiber patch cable can be purchased on AliExpress for about $40, or $70 from Thorlabs.
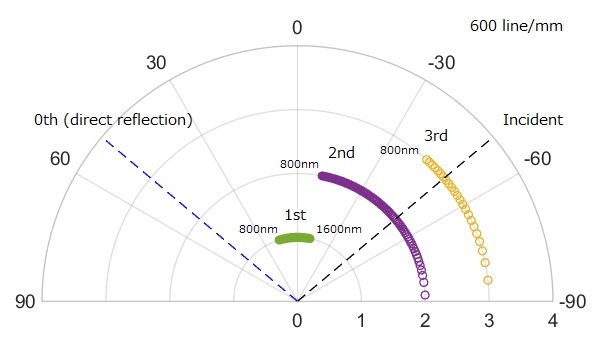
The diffracting element is typically a grating. It is important to choose a grating with the right line density to obtain reasonable dispersion (wavelength per degree of angle) at the designed order of diffraction (1st-order is most commonly used). For this project since the design wavelength is 800 nm ~ 1600nm, a line density of 600 line per mm is about right, and this gives a dispersion of 40° over the designed wavelength range. See below for a plot of angle-of-diffraction for 50° incident angle onto a 600 line/mm grating. The 2nd and 3rd orders are clearly not usable as they overlap with the incident beam.
Next comes the detector. How are we gonna detect light from a range of angles with only a single 'pixel' of photodiode? We mount the photodiode on a motor and scan it across! To do this, I purchased a stepper-driven linear stage from Amazon for $50. This little stage is quite well-built and allows a resolution-per-step of 5 um, more than enough for our resolution.
The InGaAs photodiode mentioned above has an active area of ϕ1mm, while the image of the 50 um input slit is gonna be a bit smaller than that. So an output slit also needs to be mounted as close as possible to the photodiode, in order to make sure that the size of the photodiode does not compromise the spectral resolution. This does not need to be of great precision —— I simply used some aluminum masking tape to make a slit of ~0.3 mm wide.
Lastly, we need optics to connect all these components together. It turns out that this part is quite expensive and tricky if you want high spectral resolution as well as high light throughput (which ultimately determines the signal/noise ratio). Basically, starting from the input slit (which can be viewed as a point source), we need to (1) defocus it into a parallel beam, (2) direct it onto the grating, and (3) focus the diffracted beam (which is approximately parallel for each color) onto the sensor. Traditionally, the standard way is an all-mirror configuration known as the Czerny-Turner design. The reason to use mirrors instead of lenses is to minimize chromatic aberrations, so that all wavelengths can be focus onto the same focal plane. However, the alignment of these parabolic mirrors are quite difficult without a real optics bench, so I decided to pursue a different path that is much more friendly for DIYing.
The first step —— defocusing fiber output into parallel beam, can be achieved using a fiber collimator. This is basically a lens pre-aligned with its back focal point right at the interface of the optical fiber core.
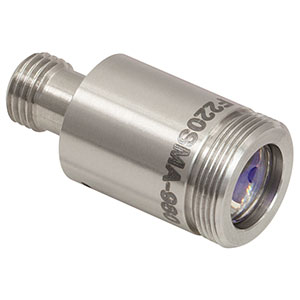
One end of this device is already threaded with standard SMA-905 connector, so that the fiber patch cable can be directly connected to it. The other end is free-space output of parallel beam. Very easy to use!
However, the lens used in the collimator does have a chromatic aberration, so that only the beam at the designed wavelength (980 nm in my case) is truly collimated. Shorter wavelengths converge a little bit and longer wavelengths diverge a little bit. Fortunately, the level of dispersion appears to be tolerable, and it can be further corrected by optimizing the location of the detector.
The fiber collimator is not super cheap —— it sells for $160 on Thorlabs. While there are other options, they are either even more pricy, or appears much less well-built than the Thorlabs one. I was lucky to find a pair being sold on eBay for $70 each, so I can use one on each end of the fiber.
Next, directing the beam onto the diffraction grating is easy, as you just need a good silver-coated mirror. Again, I found one (12.7mm x 12.7mm) on eBay for $25, while a new one sells for $35 on Thorlabs. I assume that any decent mirror you can find will probably work, but don't use a dielectric mirror if it's designed for visible, as it's probably gonna be out-of-band for near-IR wavelengths that we need.
The last piece of optics is a lens/mirror to re-focus the diffracted beam onto the detector. Our beam is a ϕ2mm circular beam for each color. To simplify things a bit again, I chose to use a cylindrical lens to focus the light in the plane of diffraction. There are mainly two benifits of this: (1) the focused beam is a line of ~0.5 mm wide (beam waist) and ~2 mm tall (size of the original circular beam). This makes the alignment of the diffraction plane and the detector relatively unimportant (tolerance ~1 mm). (2) The rectangular shape of the cylindrical lens is easier to mount with than a circular lens. You just need a piece of double-sided tape!
The optical layout is shown in the figure below, together with a raytracing of the light path using Optometrika.
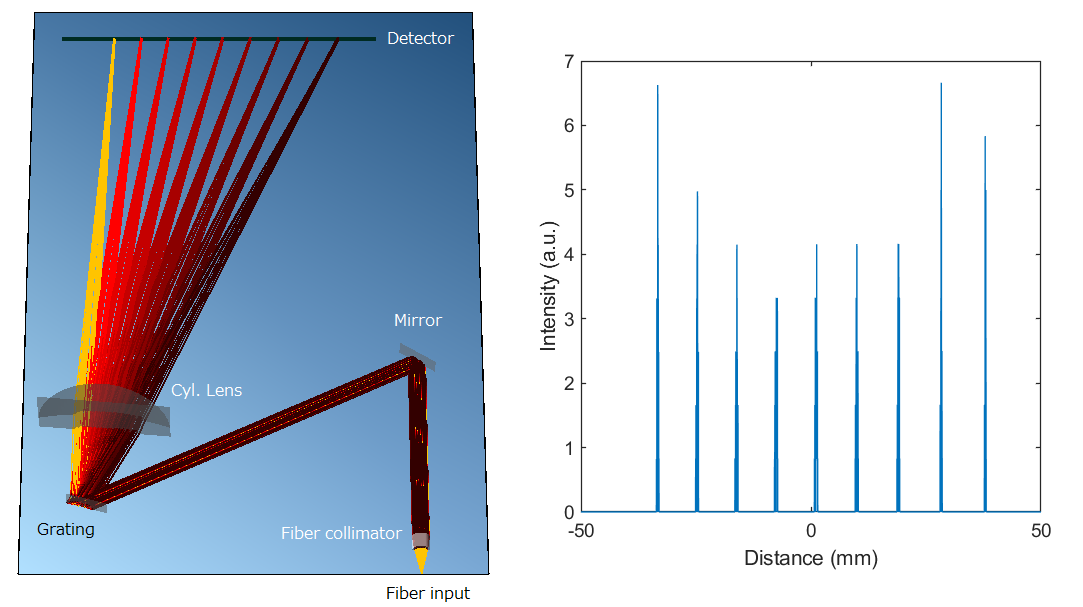
The placement of the cylindrical lens (position & angle) affects the focal point for different wavelength. I did not do a rigorous calculation here —— I simply resorted to a trial-and-error method to figure out the optimal placement. The tolerance appears to be quite large, probably because of its relatively long focal length (150 mm) compared to the beam size.
The theoretical resolution (without considering optical aberrations) can be estimated based on the parameters of the optics used here. The magnification of the optical train is 150 mm (cyl. lens) / 11 mm (fiber collimator) = 13.6 times. There are three major sources of broadening:
- Input slit: The 50 um fiber core creates an image of 0.05 × 13.6 = 0.68 mm spot at the screen. This corresponds to about 6 nm broadening in wavelength.
- Grating: The finite beam diameter at the grating limits the spectral resolution. Resolving power of a grating (using 1st order) is equal to the number of lines being illuminated. A beam spot of 2mm has a resolving power of 1,200, so this contributes to a broadening of ~1 nm in wavelength.
- Output slit: the slit at the photodiode further broadens the spectral response by about 3 nm.
You can see that the major source of broadening comes from the input slit size (fiber core size). To improve upon this without compromising light throughput, one would use a fiber collimator with larger lens/mirror and longer focal length (which is also more expensive) so that the magnification of the system is reduced. Since the input 'slit' is in fact circular, the broadening is less severe than 6 nm. My spectrometer eventually achieved a measured FWHM of 3~4 nm @ 1000 nm, and 5~6 nm @ 1500 nm, which is more than adequate for me.
In fact, this resolution is pretty darn good considering the simplicity. For reference, an InGaAs spectrometer sold by Edmund Optics using the same SMA-905 fiber input claims a resolution of 4 nm, and a compact spectrometer by Ocean Insight has a nominal FWHM of 10 nm. FYI, they sell for ~$12,000 and ~$8,000 respectively.
Make
The core of the spectrometer is a diffraction grating, which diffracts the light towards different angles according to its wavelength. Instead of using part of a CD-ROM, here I used a legitimate blazed reflective grating from Thorlabs, which sells for $70. The parameters of the grating is: 600 line/mm, 12.7mm x 12.7mm x 6mm, blazed for 1000 nm.
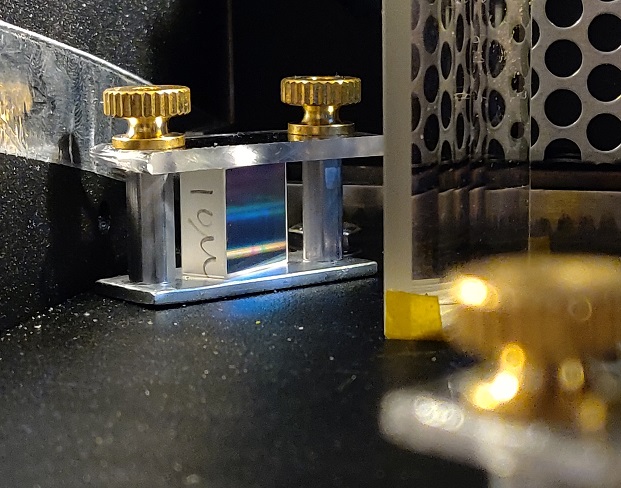
As you can see from the picture, for small square optical components, I made a small "optical mount" to clamp down the optics parts firmly without damaging them.
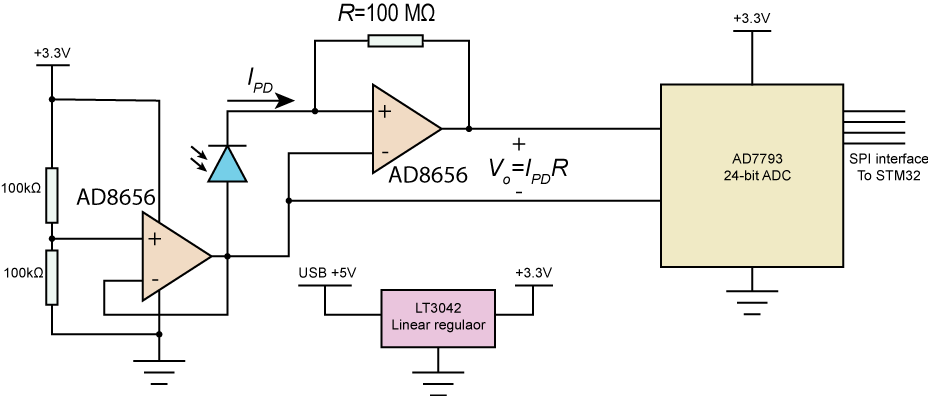
The electronics part of the detector mainly consists of a transimpedance amplifier and a 24-bit analog-digital converter (ADC). The core is a AD8656 operational amplifier with an ultralow input bias current of 1 pA and extremely low noise. This allows to use a huge gain resistor R of 100 megaohm, which converts each pA to 100 uV! The photodiode is operated with zero bias voltage, or in the so called 'photovoltaic' mode, to eliminate dark current. After that, the signal is fed into AD7793, a precision low-noise ADC with digital filtering. The output data rate is programmable, with the slowest speed (4.17 Hz) giving the lowest noise of 40 nV, which is negligible compared to other sources of noise.
One big issue for this circuit is the power supply, which is provided by the 5V USB power. USB power is notorious for its large fluctuations and ripples from the computer switching power supply. To circumvent this, I used the best possible linear regulator on the market —— LT3042 from Analog Devices, which boasts extremely high Power Supply Rejection Ratio (PSRR) of over 100 dB. This chip turns out to be working magically well for dealing with dirty power.
I find that the circuit is extremely vulnerable towards capacitive coupling with any surrounding conductor with voltages, most notably myself that emanates tons of 60 Hz noise... This is mostly likely because of the high impedance node at the input of the opamp (tens of megaohm). Electrostatic shielding (NOT the typical EMI shielding) is absolutely crucial for this. I wrapped the circuit board and photodiode all around with grounded aluminum tape/foil/plate, but a better way would be to use dedicated photodiode sockets connected to coaxial cable that is fed into a PCB with double ground planes.
With all external sources screened out, the remaining intrinsic noise comes from three places: (1) the photodiode, (2) the amplifier, and (3) the feedback resistor R. At the frequencies (1~100 Hz) of the measurement, the amplifier noise is mainly 1/f noise, which is hard to average out. According to the datasheet, the total noise from 0.1~10 Hz is about 0.3 uVrms, which is equivalent to 3 fA at the input. The resistor R and photodiode both contribute through thermal noise, which contributes 13 fA/√Hz and 9 fA/√Hz (assuming a shunt resistance of 200 MΩ) respectively at room temperature. If we measure at the slowest speed of 4.17 Hz, the noise can be estimated by RMS sum of these values, which equals 30 fA.
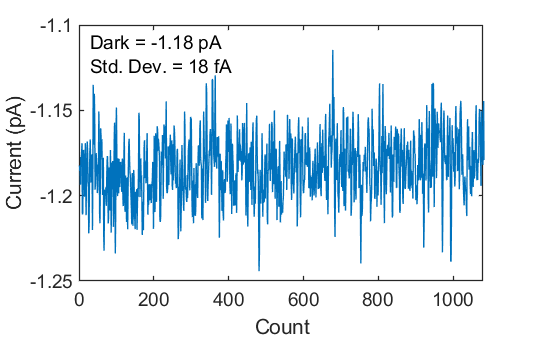
By comparison, the plot on the left shows that the standard deviation of the signal when there is no light is about 18 fA, meaning that the circuit is essentially limited by thermal noise of the system. Further improvement will require putting the sensor and amplifier into liquid nitrogen!
Below are some pictures of other parts of the build.
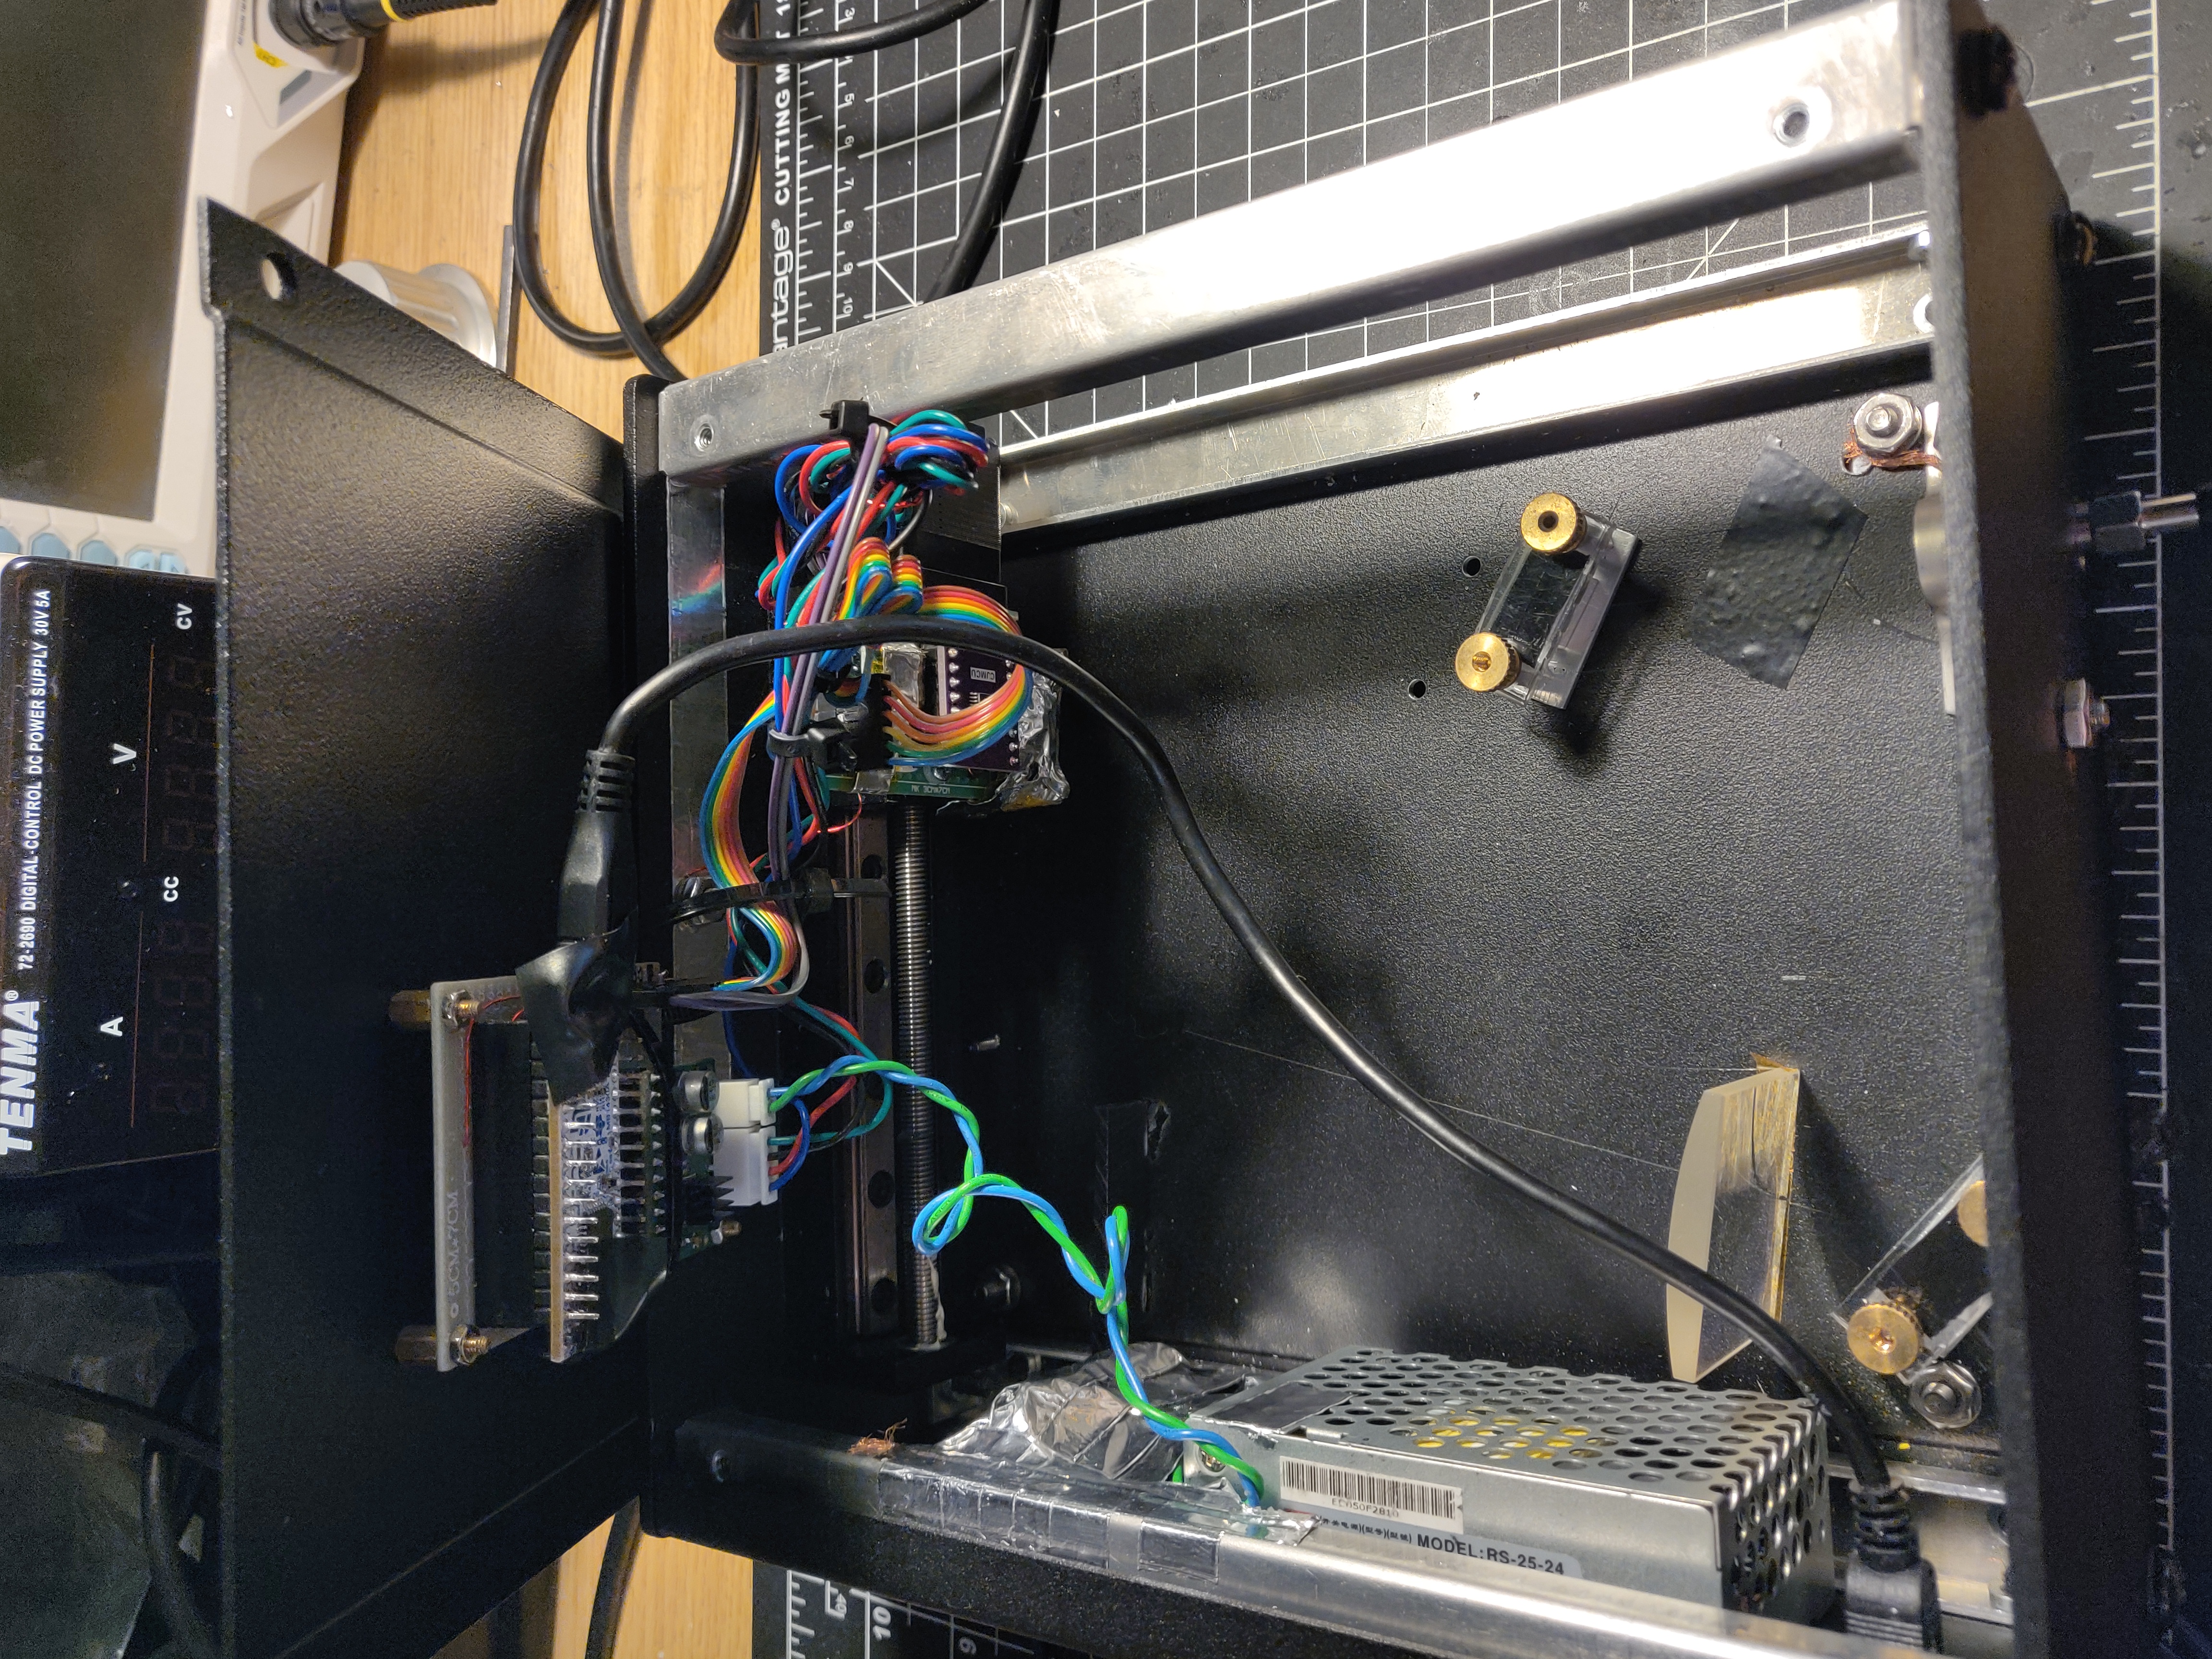
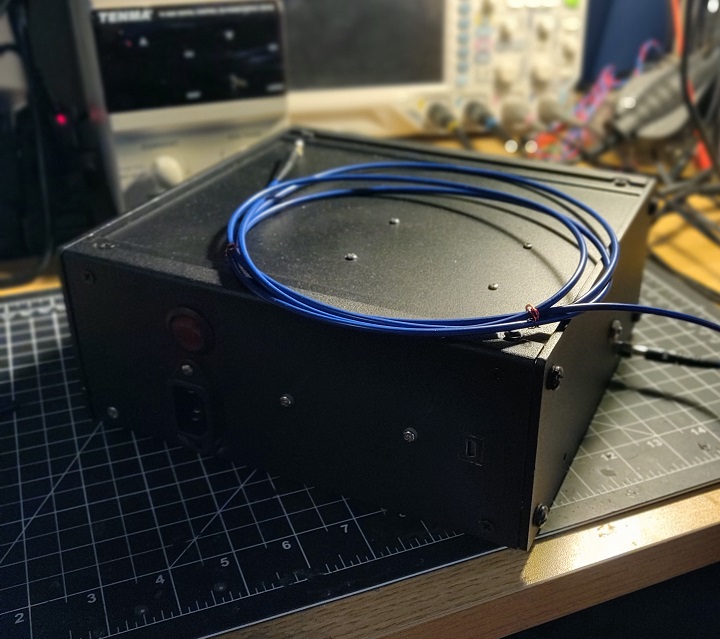
This pictures shows all components in the IR spectrometer. Power supply (5V 2A) is attached to the left wall, controller board is top, and detector board is fixed to the linear stepper motor (Amazon).
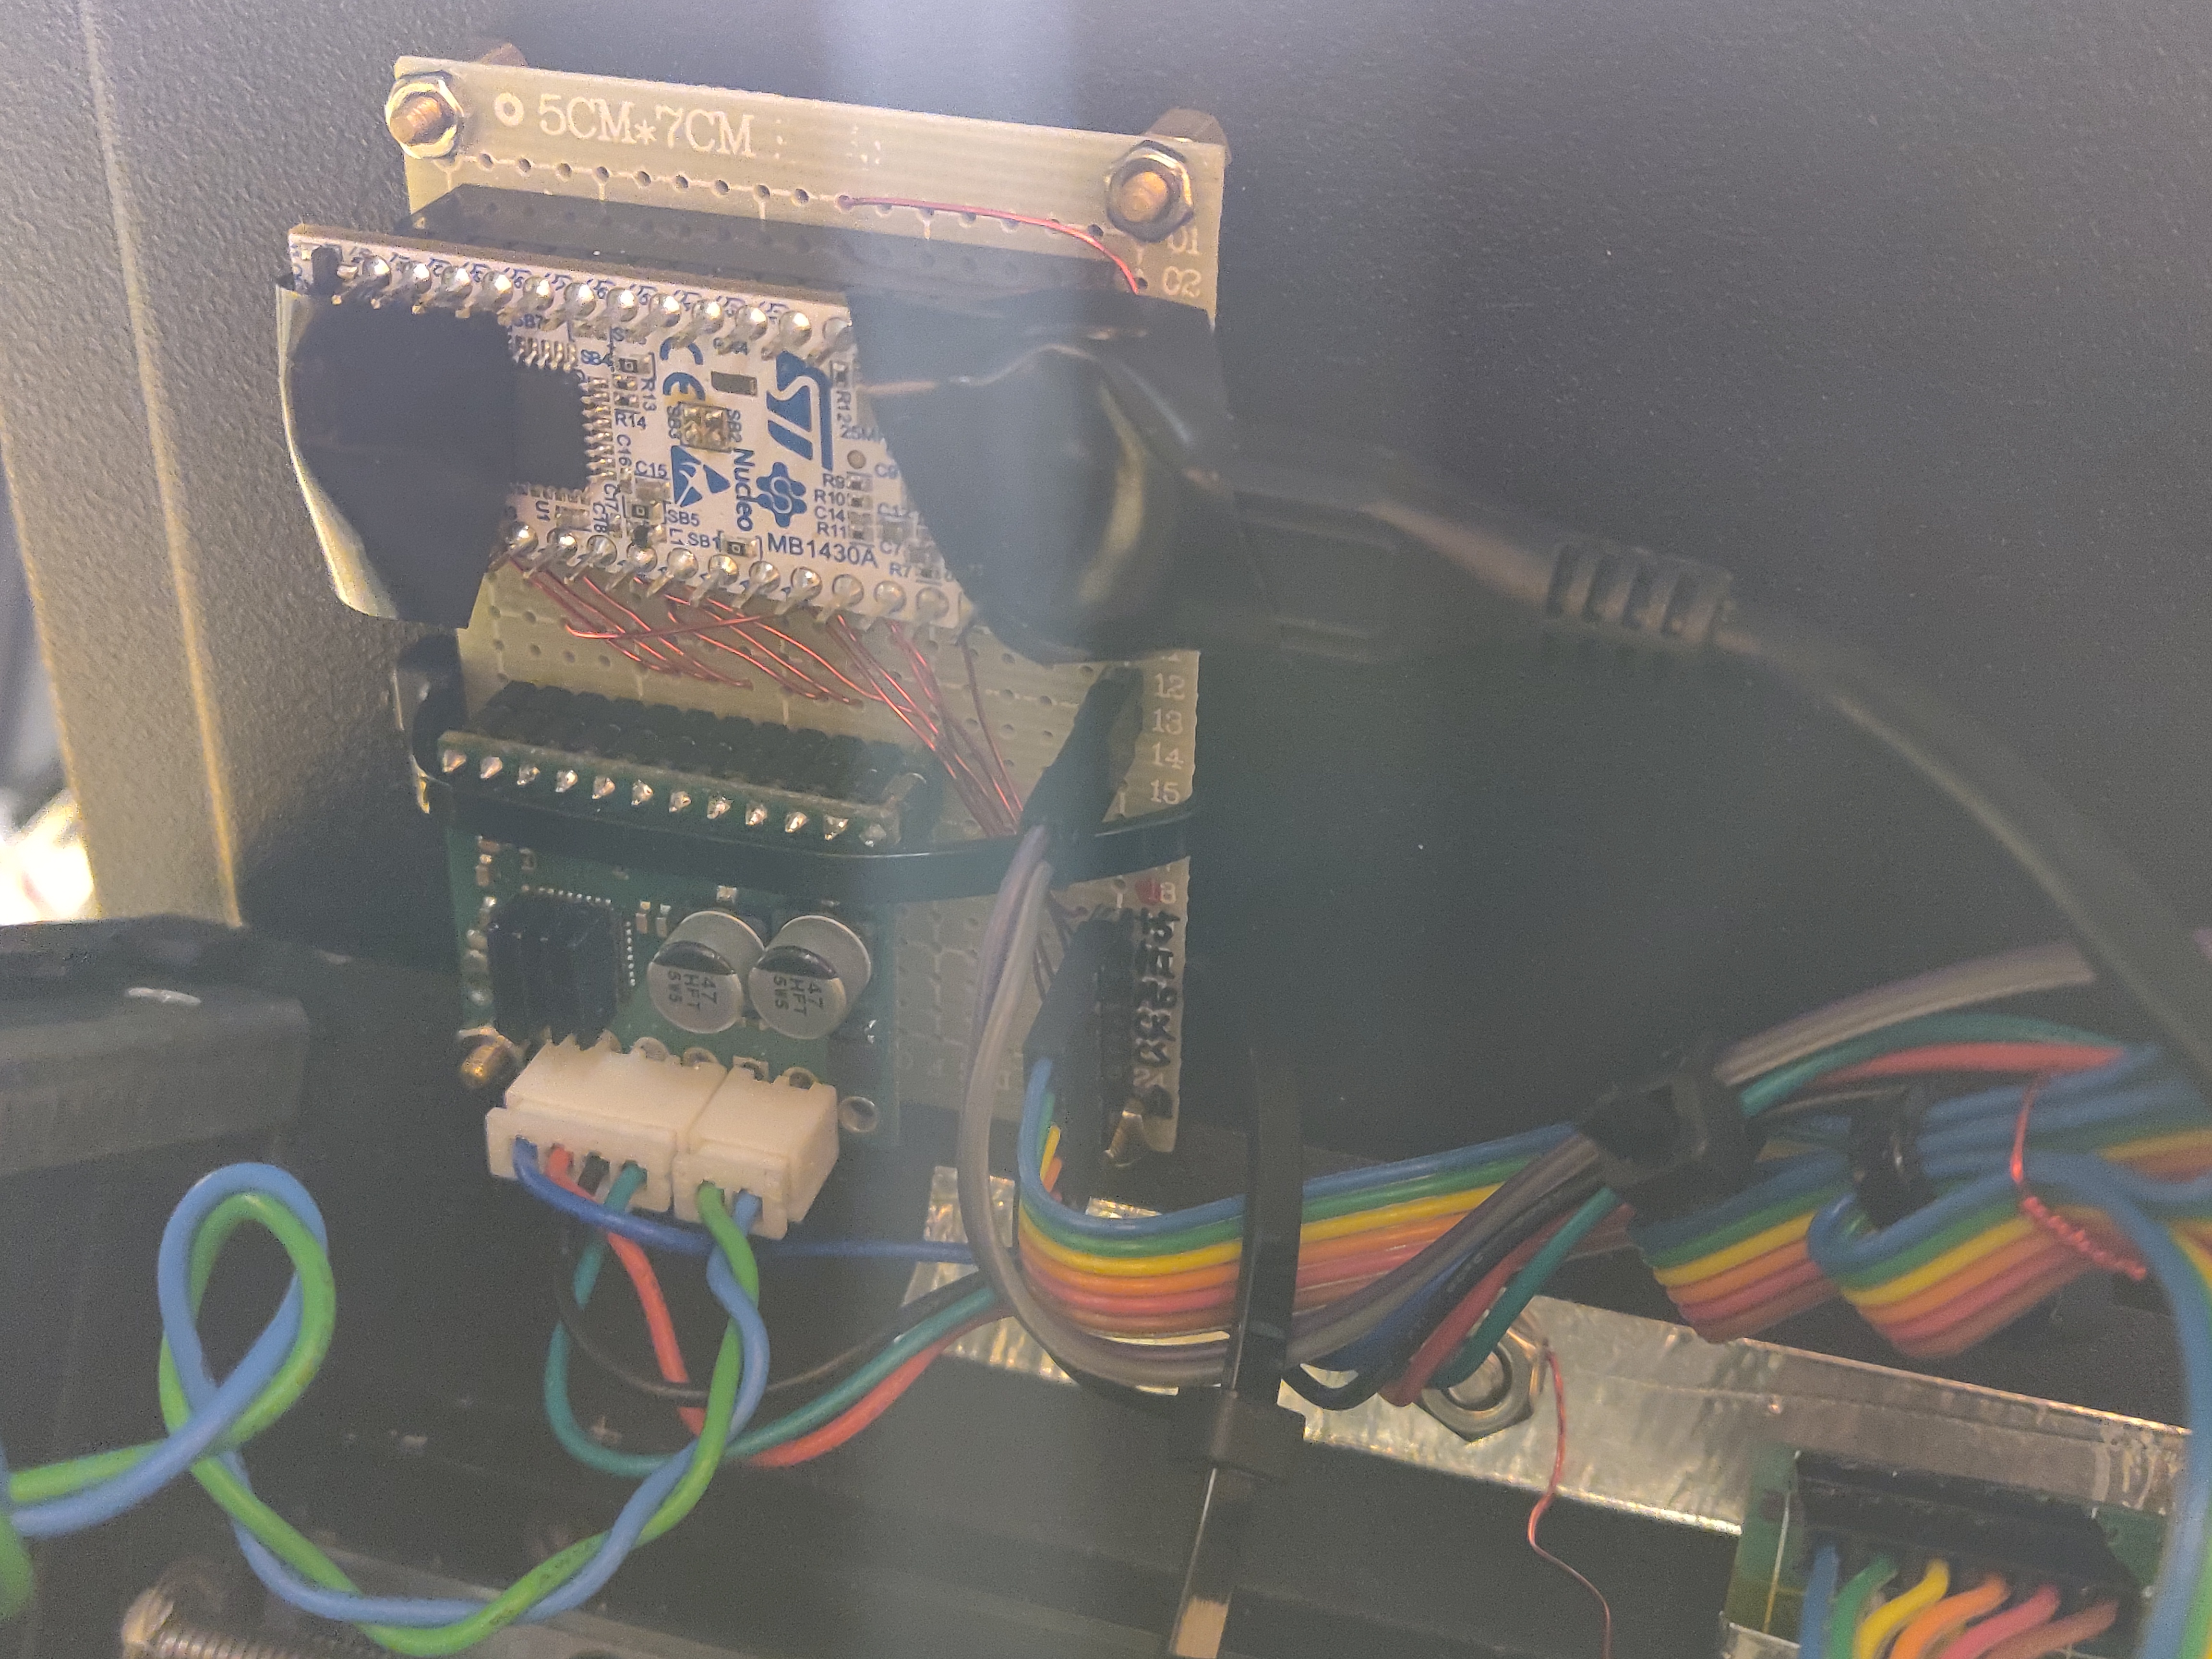
This is the controller board. Microcontroller is a STM32 Nucleo-32 board, and the green one is stepper motor driver.
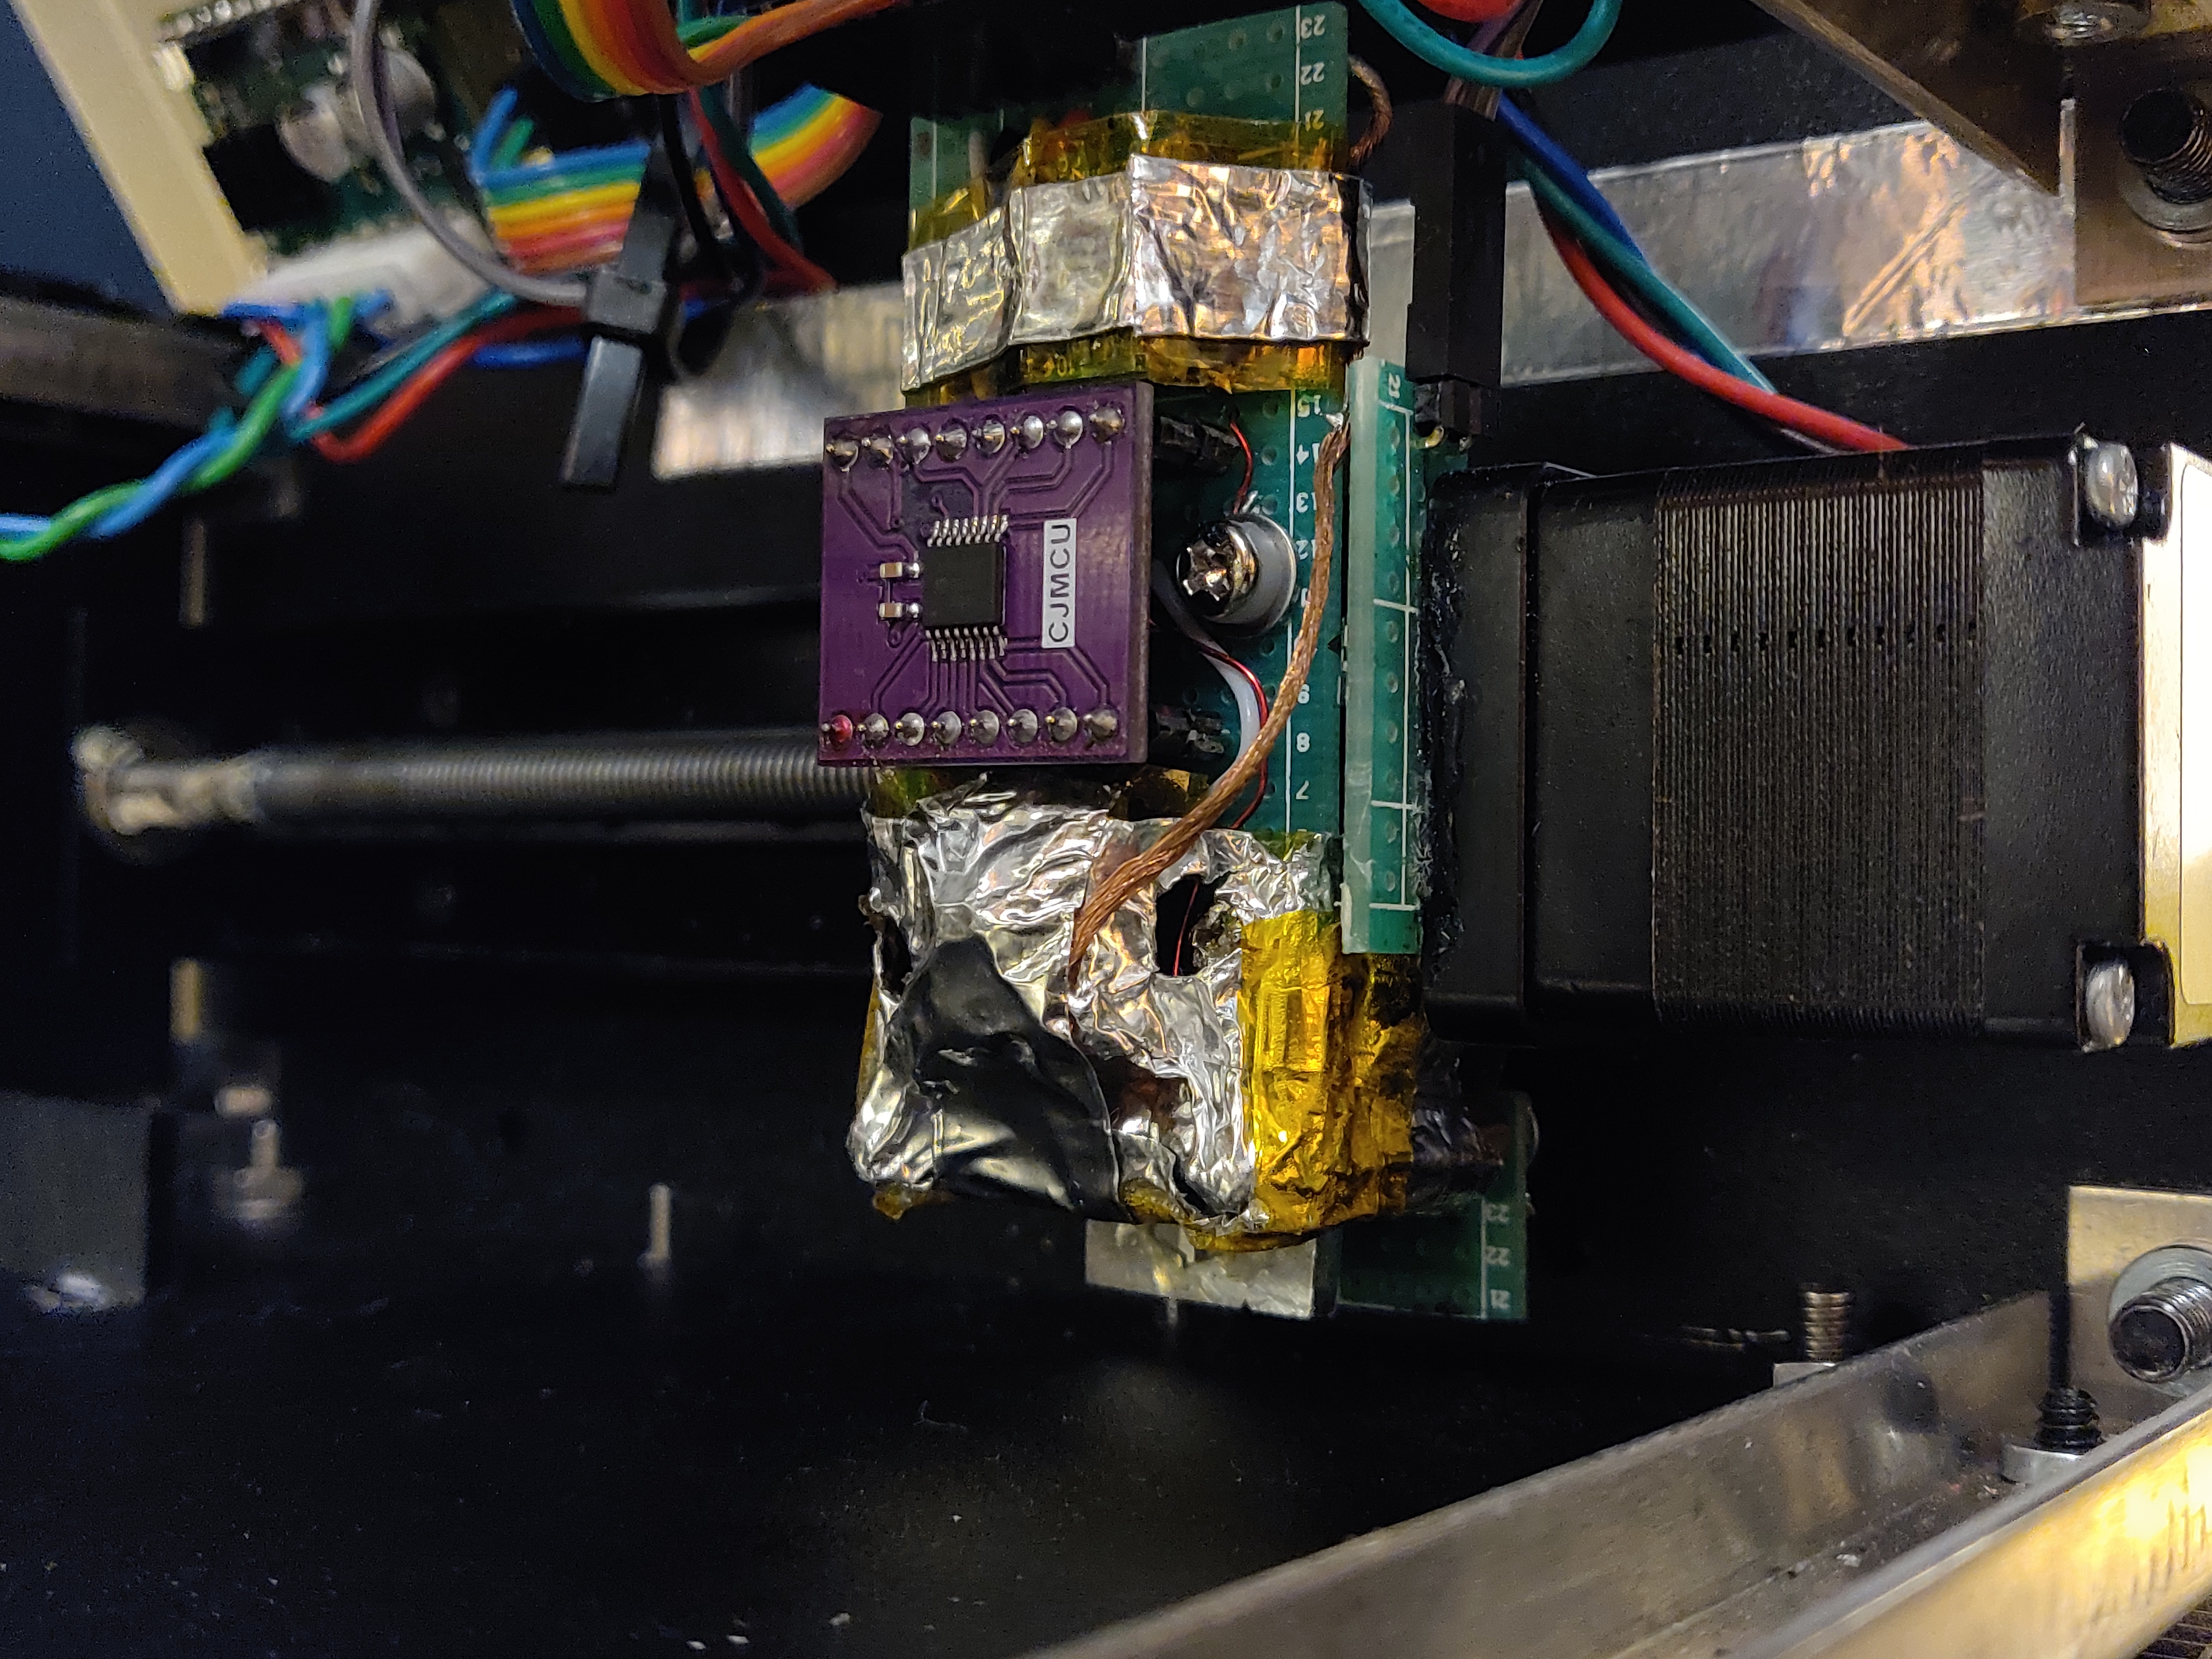
This is the detector board, which has the low-noise regulator, A-D converter, and transimpedance amplifier as described above. Note the shielding tape around the amplifier. Imporant for low noise! Actual photodiode is in the small piece of board seen below the stepper motor. In this picture, there is an aluminum block before the photodiode, which hosts the slit made of razor blades. Later on I switched to simply putting two pieces of black tape directly onto the front window of the photodiode, because it seems like if the slit is too far from the photodiode, light throughput is significantly reduced at large incident angles (i.e. near the end of the spectral range).
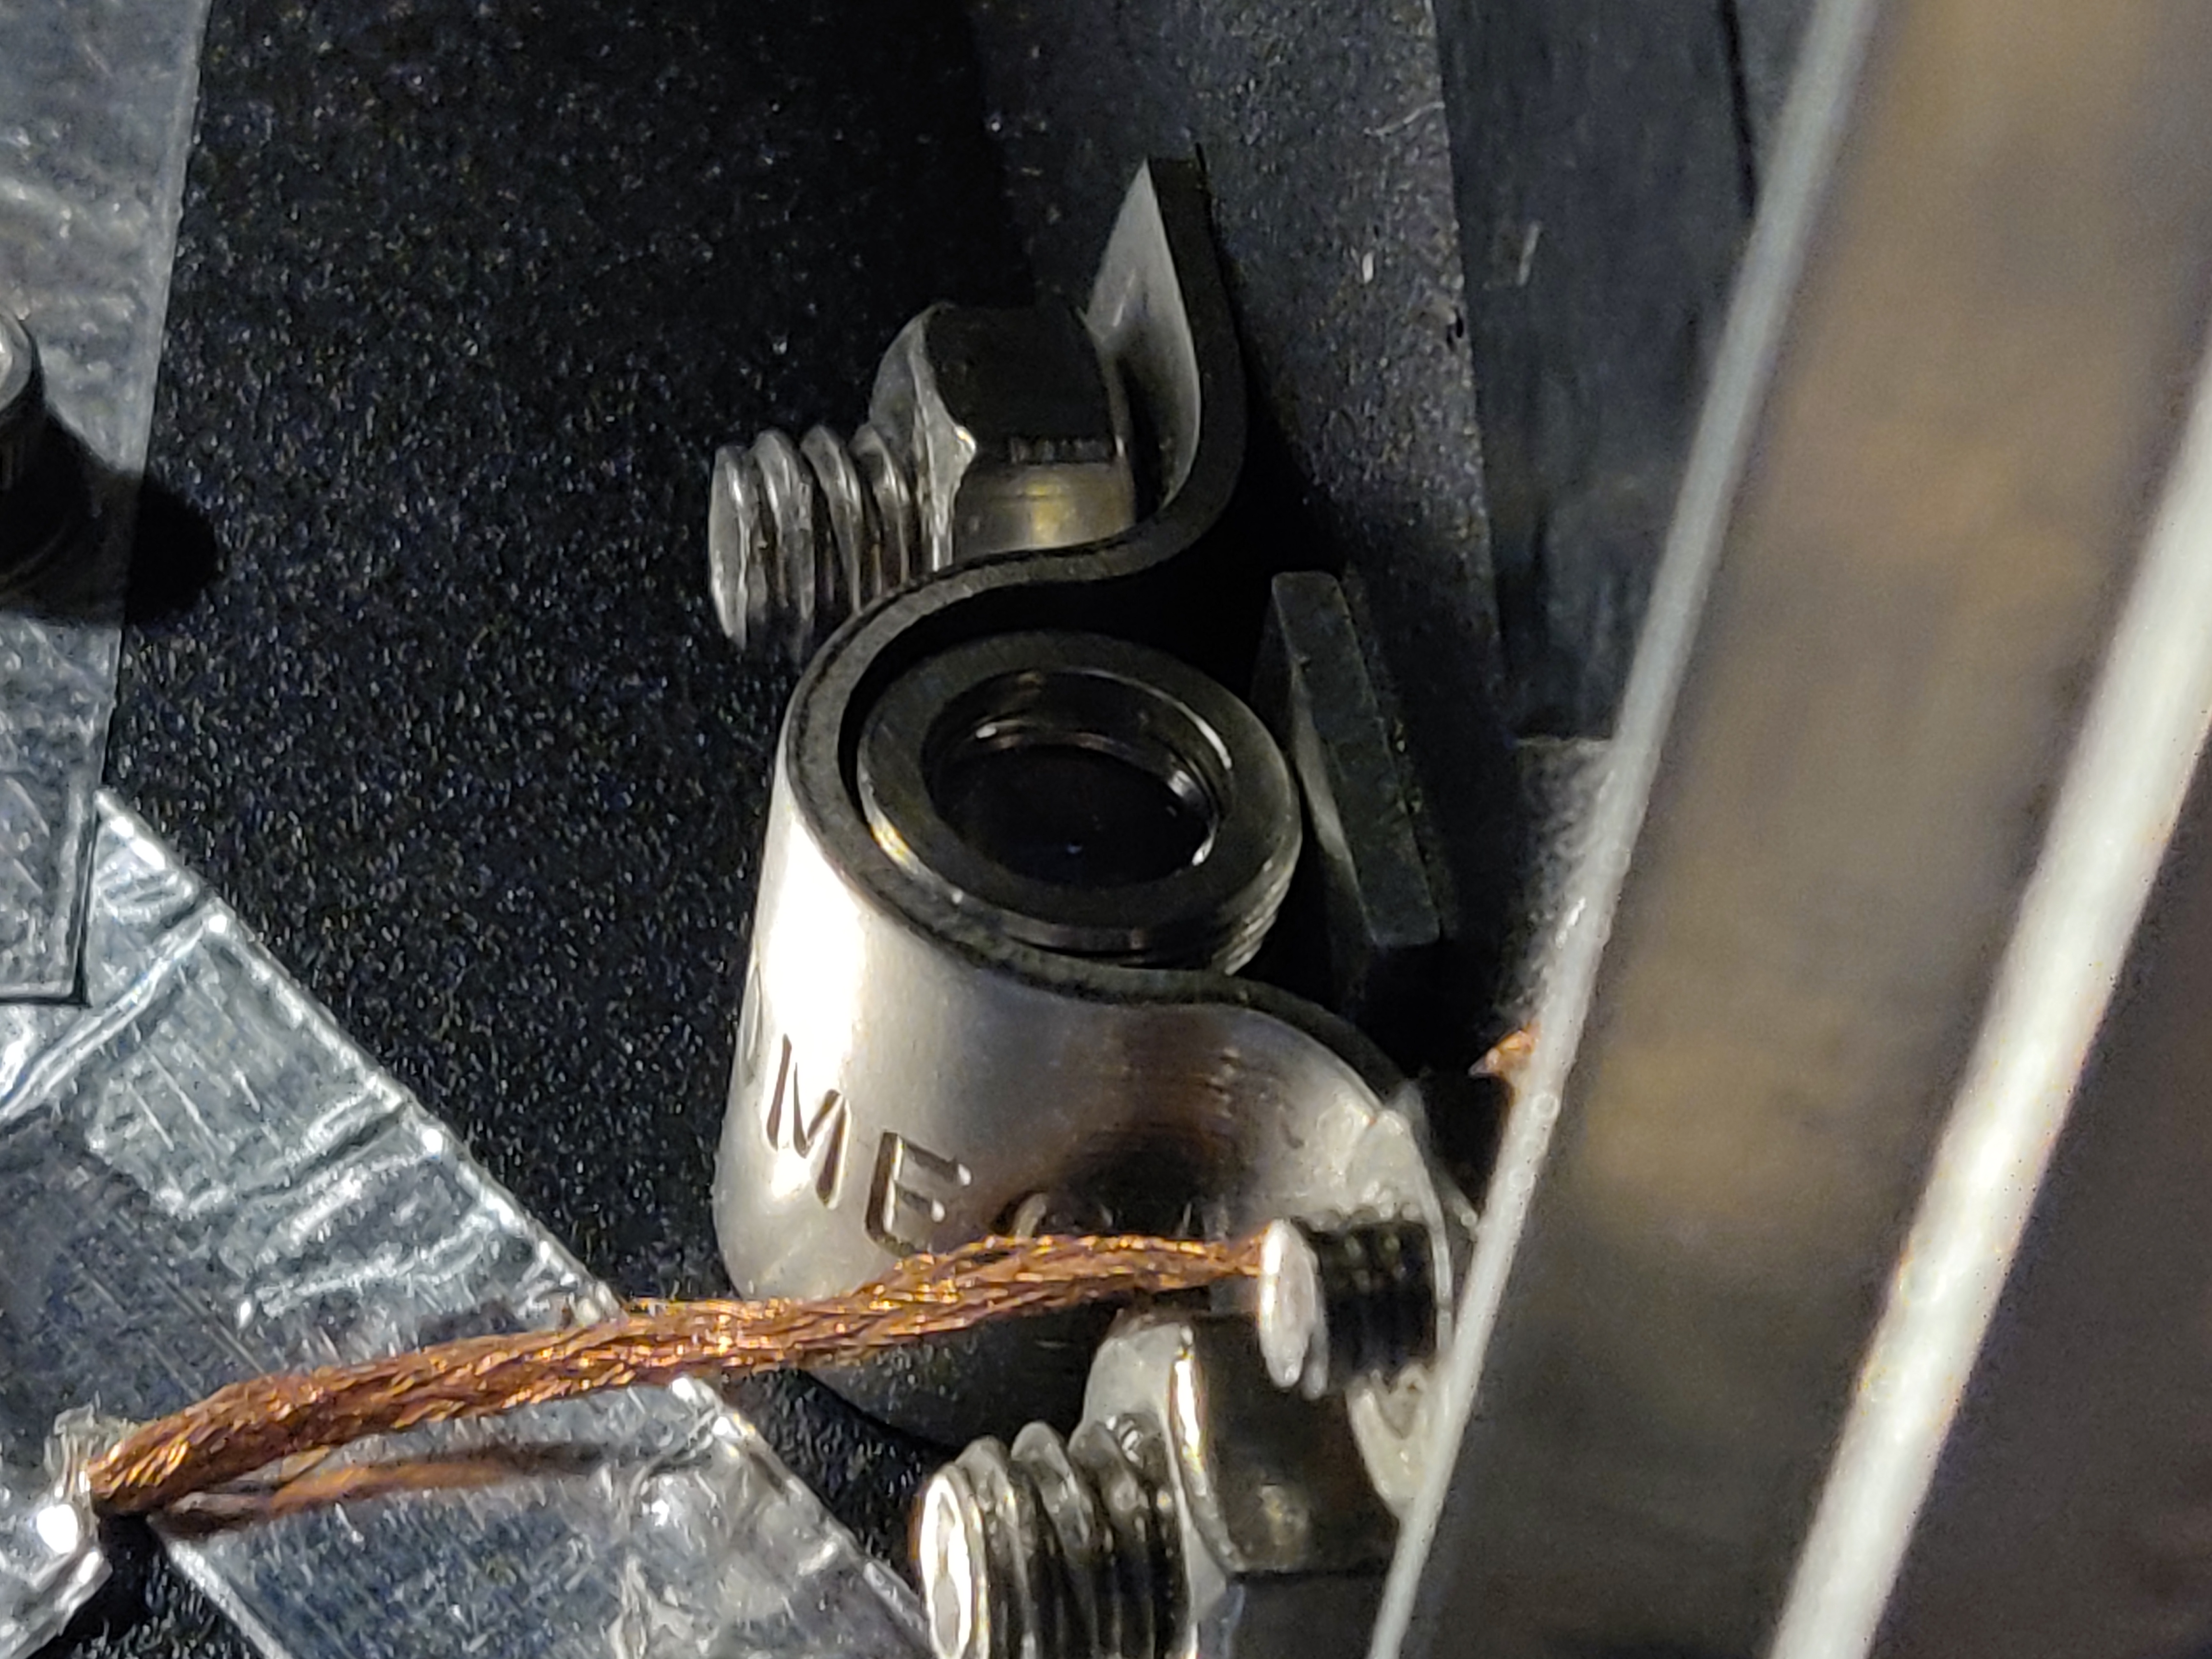
Close-up of the fiber coupler, fixed to the base of the box by a clamp.
Performance
To test the performance of the spectrometer, we need a light source with known wavelength and linewidth. For a rough alignment I use my 505 nm green laser pen, which should get refracted to the 2nd order at exactly the same angle as 1010 nm light would be refracted to the 1st order. For conversion from the position of the detector to wavelength, however, a calibration source is needed. Typically, a mercury lamp or argon-neon calibrating lamp is used for this purpose, because these elements have a few bright and sharp emission lines in the visible to near-IR range. But these dedicated lamps are quite expensive (Newport sells them for ~$300). Another possibility is to use gas spectrum tubes that are used in undergrad physics labs. But these tubes require a special high-voltage power supply, which takes extra effort to acquire.
Later I figured out that my desk lamp is actually a perfect calibration light source. Be aware that it has to be a fluorescent type light bulb —— either LED bulb or incandescent bulb won't work here. The reason is that fluorescent bulbs are filled with mercury vapor plus some inert gas, which get excited by the electricity to emit light mostly in the ultraviolet. These ultraviolet photons are then converted to visible light by phosphor salts coated in the inner surface of the tube. However, ultraviolet is not all that mercury emits. Neutral mercury in fact has a couple of decently strong emission lines at 436, 543, 546, 1014, 1357, 1367, and 1530 nm as well. The last 4 lines are quite useful in calibrating our near-IR spectrometer. Furthermore, my desk lamp seems to be also filled with argon gas. Argon has quite some emission lines in the near-IR range, especially in the 800~1000 nm range.
The procedure of calibration is very simple. We take a spectrum (intensity versus distance), identify the lines, and find the correspondance between position and wavelength for at these lines. Then an interpolation smoothly connects between these key points, so that any position can be converted to wavelength or vice versa. The following figure shows an example of calibrated spectrum of my desk lamp, annotated with their emission lines.
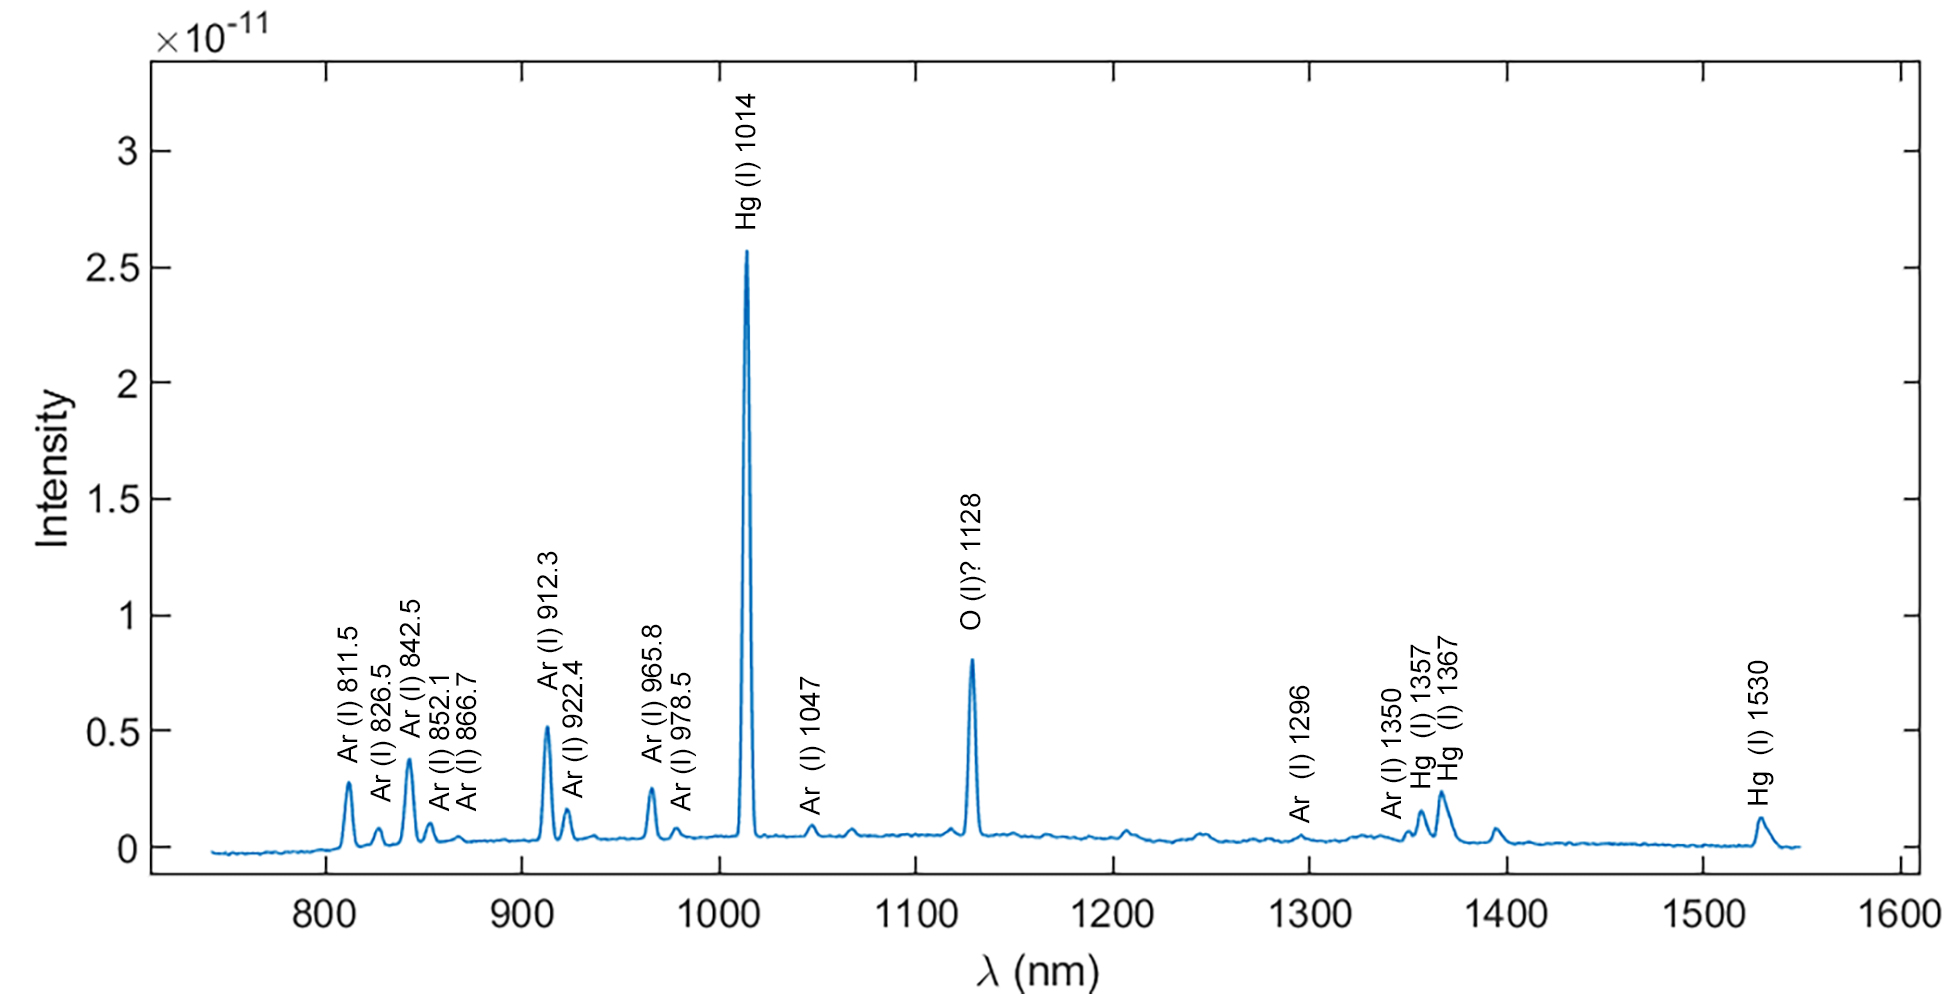
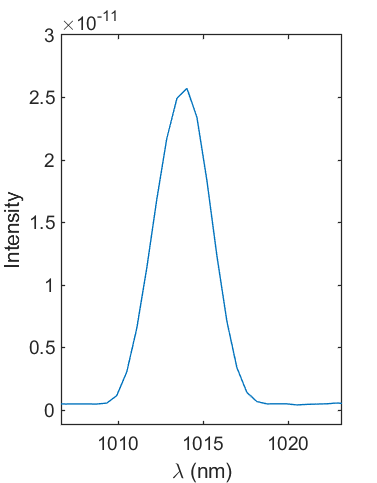
Pretty good, isn't it? I tried to align the cylindrical lens so that the 1014 nm peak is sharpest (FWHM ~3 nm, see left), while somewhat compromising the resolution at long wavelengths (FWHM 5~6 nm at 1500 nm). Overall, I'm quite satisfied with this resolution considering the investment.
The next step is to calibrate the spectral response function, that is the amplitude of the signal per unit input flux of light at different wavelengths. This calibration can be carried out less stringently, as an error of 10% in absolute signal scale usually does not create much problem (for reflection/transmission measurements, it is the change of signal that matters anyway). I used a $10 quartz halogen lamp (a type of incandescent bulb) bought at local hardware store as a black-body source (assumed to be 3200 K) to calibrate the spectral response.
Let's now use it to measure something more interesting! In fact, I bought a separate fiber illuminator on eBay for $70 for measuring transmission spectrum of filters and crystals. I also built a mini test bench with translation stage for the ease of aligning the beam and the crystal:
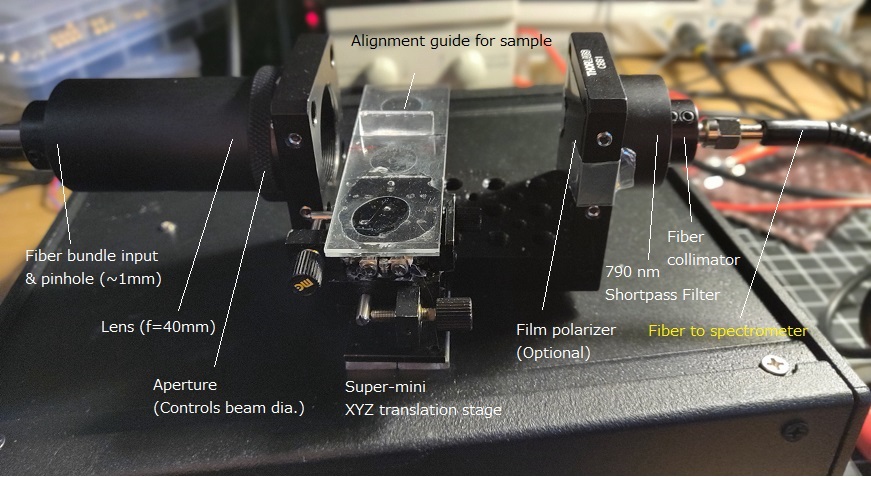
The aperture and lens creates a (white) beam with divergence of ~2° and beam diameter adjustable from ~0.5 mm to 1 cm. On the other end of the test bench, the same fiber collimator collects the collimated light into the optics fiber to be sent to the spectrometer. A 790 nm long-pass filter is mounted right before the collimator —— this is to prevent 2nd order diffraction of visible light from interfering with near-IR measurements. With this bench, we can measure the transmission of any flat sample, that is things without any optical power. Measurement of optical elements like lens are more tricky because the shape of the beam changes when they are inserted, resulting in inaccurate measurements.
Here is the transmission curve of a Nd-doped YAG crystal (2×2×10 mm, 1% doped), which is extensively used in solid-state lasers.
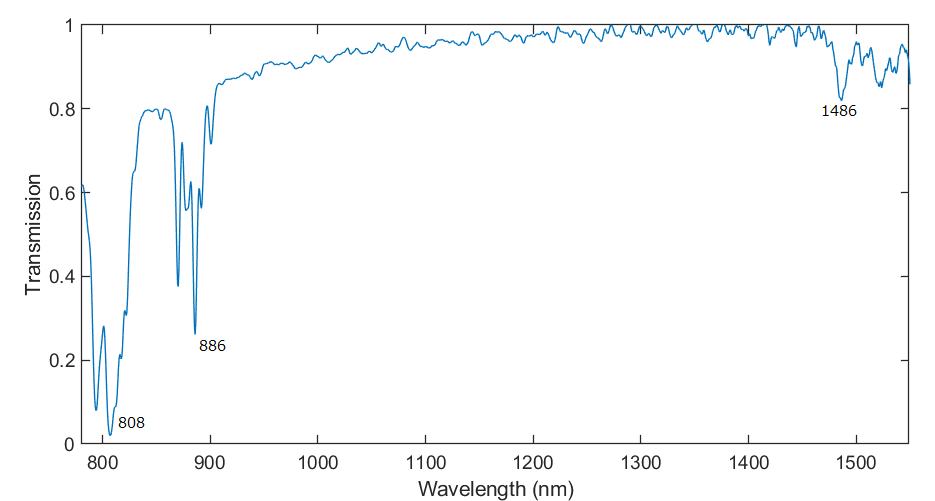
In this curve, there is a background that comes from reflection on the interfaces (which I believe is anti-reflection coated for 1310 nm), and sharp peaks that comes from absorption in the Nd:YAG crystal. Light at 808 nm, the wavelength that is most frequently used for diode-pumping of these crystals, is almost perfectly absorbed by this crystal.
I happen to have 808 nm pump diodes at hand, so we can also do a fluorescence spectrum. The diode is driven with a moderate current, which produces about ~ 100 mW of 808 nm output.
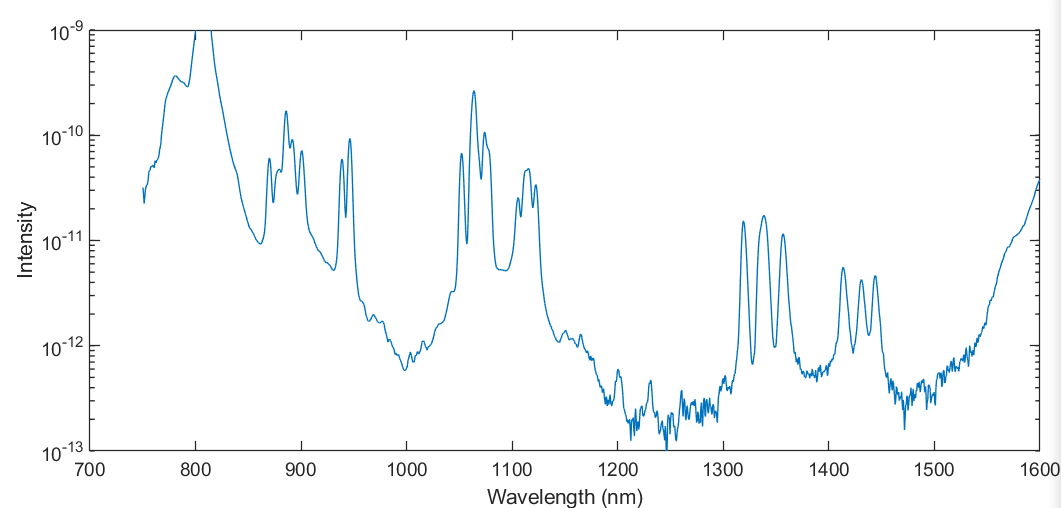
Here I plotted the intensity in log scale to flush out all features. While 1064 nm is of course the strongest peak, all other major emission lines at 946 nm, 1116 nm, 1319 nm, 1338 nm, 1357 nm, 1414 nm, 1431 nm, and 1444 nm are also quite obvious. From this spectrum, we can approximately determine the dynamic range of our spectrometer. In this setting (gain 16, time constant 1/8.33 Hz), the maximum signal measurable is 800 pA, while the noise floor is about 0.2 pA. So we have a dynamic range of 4,000:1, or 72 dB. This can be further improved to 100,000:1 if we use a larger time constant and smaller gain.
This is pretty much it for now. I'll put more spectra here if I take more cool ones in the future. I hope this article is useful for you if you also want to build a IR spectrometer without wanting to spend $10,000!